Ravnica Allegiance
Released January 2019 · 273 cards
Set Overview
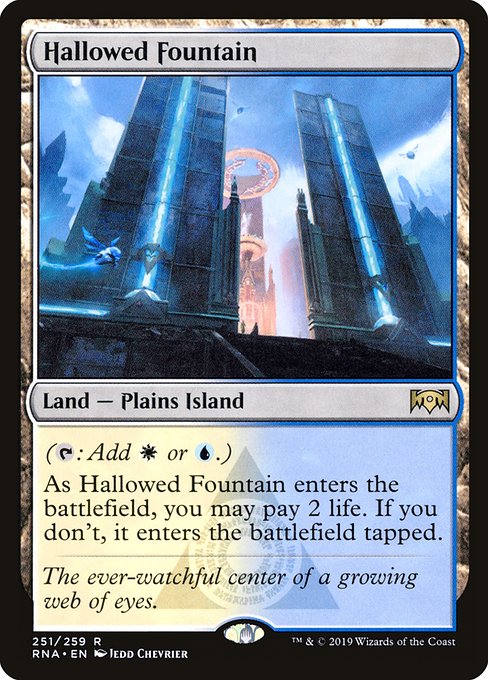
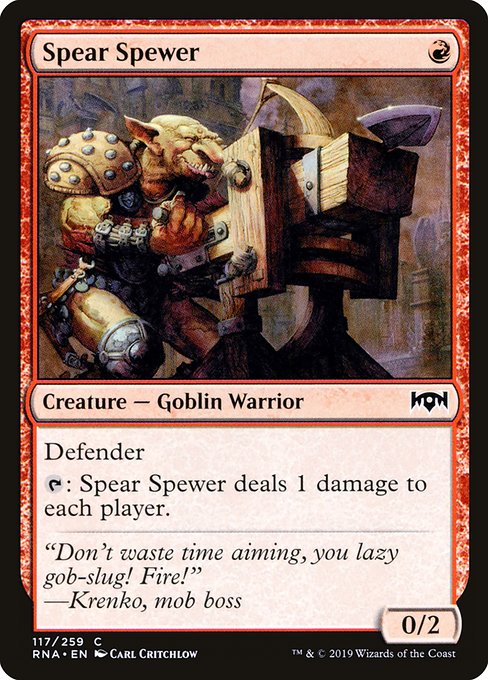
273 cards with a combined index value of $198.54. Flat over the last 30 days. Top performers: Hallowed Fountain, Spear Spewer. Sealed: - Booster Box, - Bundle.
Value by Rarity
Top Gainers
| Card | Price | Change |
|---|---|---|
| $9.06 | +21.0% | |
| $0.26 | +8.3% | |
| $0.30 | +7.1% | |
| $0.33 | +6.5% | |
| $0.30 | +3.4% | |
| $0.30 | +3.4% | |
| $0.31 | +3.3% | |
| $0.32 | +3.2% | |
| $0.33 | +3.1% | |
| $0.34 | +3.0% |
Top Losers
| Card | Price | Change |
|---|---|---|
| $0.34 | -8.1% | |
| $0.28 | -6.7% | |
| $2.48 | -6.1% | |
| $1.76 | -3.8% | |
| $0.28 | -3.4% | |
| $0.31 | -3.1% | |
| $0.33 | -2.9% | |
| $0.34 | -2.9% | |
| $0.36 | -2.7% | |
| $1.47 | -2.6% |
All Cards in Ravnica Allegiance (332)
- Smothering Tithe$55.97
- Smothering Tithe$50.00
- Blood Crypt$15.37
- Hallowed Fountain$14.39
- Breeding Pool$14.03
- Guardian Project$13.65
- Guardian Project$12.58
- Breeding Pool$12.30
- Godless Shrine$10.76
- Blood Crypt$10.57
- Godless Shrine$9.87
- Stomping Ground$9.59
- Hallowed Fountain$9.06
- Stomping Ground$8.47
- Biogenic Ooze$5.67
- Rhythm of the Wild$4.60
- Captive Audience$4.43
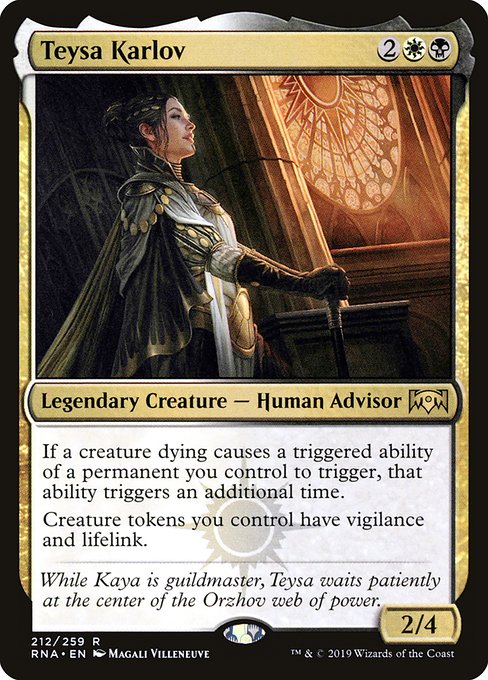
- Teysa Karlov$4.12
- Priest of Forgotten Gods$2.91
- Rakdos, the Showstopper$2.73
- Wilderness Reclamation$2.67
- Incubation Druid$2.60
- Teysa Karlov$2.48
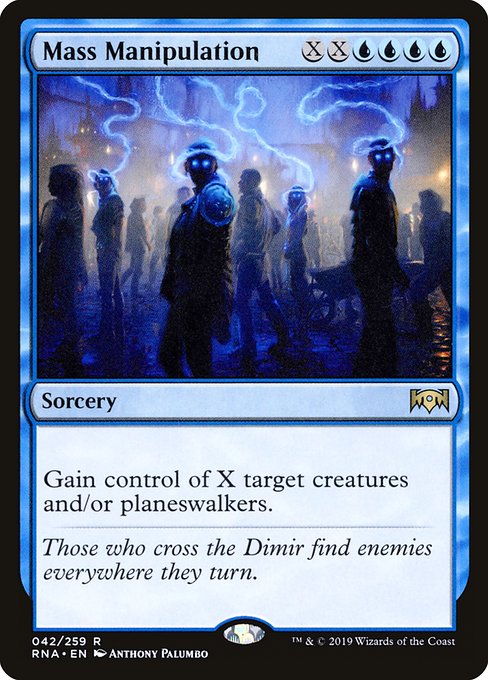
- Mass Manipulation$2.26
- Priest of Forgotten Gods$1.95
- Mirror March$1.88
- Mass Manipulation$1.76
- Incubation Druid$1.72
- Plaza of Harmony$1.68
- Simic Ascendancy$1.53
- Electrodominance$1.52
- Biogenic Ooze$1.47
- Bedevil$1.46
- Unbreakable Formation$1.42
- Biomancer's Familiar$1.37
- Spawn of Mayhem$1.37
- Seraph of the Scales$1.35
- Persistent Petitioners$1.29
- Electrodominance$1.28
- Prime Speaker Vannifar$1.20
- Skarrgan Hellkite$1.06
- Angel of Grace$1.04
- Hydroid Krasis$0.94
- Benthic Biomancer$0.91
- Gutterbones$0.83
- Cindervines$0.75
- Forest$0.75
- Kaya, Orzhov Usurper$0.71
- Unbreakable Formation$0.71
- Emergency Powers$0.70
- Font of Agonies$0.69
- Absorb$0.67
- Domri, Chaos Bringer$0.65
- Spawn of Mayhem$0.63
- Hydroid Krasis$0.62
- Mesmerizing Benthid$0.58
- Verity Circle$0.57
- Seraph of the Scales$0.56
- Tome of the Guildpact$0.56
- Dovin, Grand Arbiter$0.53
- Island$0.53
- Mountain$0.52
- Kaya's Wrath$0.51
- Plaza of Harmony$0.51
- Bedevil$0.50
- Immolation Shaman$0.49
- Kaya, Orzhov Usurper$0.45
- Kaya's Wrath$0.45
- Swamp$0.44
- Deputy of Detention$0.43
- Rampage of the Clans$0.43
- Plains$0.42
- Skarrgan Hellkite$0.42
- Pestilent Spirit$0.41
- Revival // Revenge$0.41
- Awaken the Erstwhile$0.40
- Gutterbones$0.40
- Hero of Precinct One$0.40
- Ethereal Absolution$0.39
- High Alert$0.38
- Lavinia, Azorius Renegade$0.38
- Ravager Wurm$0.38
- Sphinx of Foresight$0.38
- Tithe Taker$0.38
- Absorb$0.37
- Hero of Precinct One$0.37
- Benthic Biomancer$0.36
- Cindervines$0.36
- End-Raze Forerunners$0.36
- Deputy of Detention$0.35
- Judith, the Scourge Diva$0.35
- Tower Defense$0.35
- Collision // Colossus$0.34
- Growth Spiral$0.34
- Impassioned Orator$0.34
- Lumbering Battlement$0.34
- Nikya of the Old Ways$0.34
- Precognitive Perception$0.34
- Skewer the Critics$0.34
- Galloping Lizrog$0.33
- Gateway Plaza$0.33
- Gruul Spellbreaker$0.33
- Light Up the Stage$0.33
- Orzhov Enforcer$0.33
- Tithe Taker$0.33
- Vindictive Vampire$0.33
- Gatebreaker Ram$0.32
- Gruul Spellbreaker$0.32
- Imperious Oligarch$0.32
- Essence Capture$0.31
- Mortify$0.31
- Resolute Watchdog$0.31
- Clear the Mind$0.30
- Judith, the Scourge Diva$0.30
- Repudiate // Replicate$0.30
- Thought Collapse$0.30
- Biogenic Upgrade$0.28
- Cavalcade of Calamity$0.28
- Combine Guildmage$0.28
- Dovin's Acuity$0.28
- Justiciar's Portal$0.28
- Azorius Locket$0.27
- Gates Ablaze$0.27
- Angelic Exaltation$0.26
- Incubation // Incongruity$0.26
- Lawmage's Binding$0.26
- Pitiless Pontiff$0.26
- Spear Spewer$0.26
- Zegana, Utopian Speaker$0.26
- Archway Angel$0.25
- Bankrupt in Blood$0.25
- Dagger Caster$0.25
- Frilled Mystic$0.25
- Gyre Engineer$0.25
- Thrash // Threat$0.25
- Consecrate // Consume$0.24
- Forbidding Spirit$0.24
- Ministrant of Obligation$0.24
- Sharktocrab$0.24
- Sphinx's Insight$0.24
- Growth-Chamber Guardian$0.23
- Rix Maadi Reveler$0.23
- Simic Guildgate$0.23
- Tin Street Dodger$0.23
- Wall of Lost Thoughts$0.23
- Carnival // Carnage$0.22
- Charging War Boar$0.22
- Drill Bit$0.22
- Footlight Fiend$0.22
- Glass of the Guildpact$0.22
- Sunder Shaman$0.22
- Rakdos Locket$0.21
- Root Snare$0.21
- Saruli Caretaker$0.21
- Junktroller$0.20
- Pteramander$0.20
- Quench$0.20
- Ragefire$0.20
- Senate Guildmage$0.20
- Theater of Horrors$0.20
- Simic Locket$0.19
- Skatewing Spy$0.19
- Slimebind$0.19
- Gruul Guildgate$0.18
- Scrabbling Claws$0.18
- Trollbred Guardian$0.18
- Amplifire$0.17
- Domri's Nodorog$0.17
- Dovin's Automaton$0.17
- Elite Arrester$0.17
- Growth-Chamber Guardian$0.17
- Orzhov Locket$0.17
- Vizkopa Vampire$0.17
- Azorius Guildgate$0.16
- Gateway Sneak$0.16
- Gruul Beastmaster$0.16
- Mammoth Spider$0.16
- Rubble Reading$0.16
- Sentinel's Mark$0.16
- Spire Mangler$0.16
- Warrant // Warden$0.16
- Depose // Deploy$0.15
- Ill-Gotten Inheritance$0.15
- Blade Juggler$0.14
- Bloodmist Infiltrator$0.14
- Dead Revels$0.14
- Gruul Locket$0.14
- Open the Gates$0.14
- Syndicate Messenger$0.14
- Titanic Brawl$0.14
- Bedeck // Bedazzle$0.13
- Clamor Shaman$0.13
- Dovin's Dismissal$0.13
- Orzhov Guildgate$0.13
- Rakdos Guildgate$0.13
- Screaming Shield$0.13
- Scuttlegator$0.13
- Silhana Wayfinder$0.13
- Sphinx of New Prahv$0.13
- Thirsting Shade$0.13
- Aeromunculus$0.12
- Cry of the Carnarium$0.12
- Deface$0.12
- Eyes Everywhere$0.12
- Ghor-Clan Wrecker$0.12
- Prying Eyes$0.12
- Spikewheel Acrobat$0.12
- Axebane Beast$0.11
- Basilica Bell-Haunt$0.11
- Burn Bright$0.11
- Frenzied Arynx$0.11
- Knight of Sorrows$0.11
- Macabre Mockery$0.11
- Regenesis$0.11
- Rumbling Ruin$0.11
- Savage Smash$0.11
- Azorius Skyguard$0.10
- Catacomb Crocodile$0.10
- Cult Guildmage$0.10
- Gate Colossus$0.10
- Goblin Gathering$0.10
- Knight of the Last Breath$0.10
- Noxious Groodion$0.10
- Stony Strength$0.10
- Tenth District Veteran$0.10
- Act of Treason$0.09
- Bring to Trial$0.09
- Clan Guildmage$0.09
- Clear the Stage$0.09
- Faerie Duelist$0.09
- Steeple Creeper$0.09
- Windstorm Drake$0.09
- Wrecking Beast$0.09
- Code of Constraint$0.08
- Enraged Ceratok$0.08
- Fireblade Artist$0.08
- Rakdos Firewheeler$0.08
- Rubblebelt Recluse$0.08
- Rubblebelt Runner$0.08
- Senate Griffin$0.08
- Zhur-Taa Goblin$0.08
- Applied Biomancy$0.07
- Arrester's Admonition$0.07
- Azorius Knight-Arbiter$0.07
- Bladebrand$0.07
- Final Payment$0.07
- Hackrobat$0.07
- Rafter Demon$0.07
- Rally to Battle$0.07
- Sage's Row Savant$0.07
- Shimmer of Possibility$0.07
- Spirit of the Spires$0.07
- Syndicate Guildmage$0.07
- Twilight Panther$0.07
- Arrester's Zeal$0.06
- Bolrac-Clan Crusher$0.06
- Concordia Pegasus$0.06
- Feral Maaka$0.06
- Flames of the Raze-Boar$0.06
- Grasping Thrull$0.06
- Gravel-Hide Goblin$0.06
- Humongulus$0.06
- Rakdos Roustabout$0.06
- Rakdos Trumpeter$0.06
- Smelt-Ward Ignus$0.06
- Storm Strike$0.06
- Summary Judgment$0.06
- Chillbringer$0.05
- Consign to the Pit$0.05
- Debtors' Transport$0.05
- Expose to Daylight$0.05
- Gift of Strength$0.05
- Orzhov Racketeers$0.05
- Plague Wight$0.05
- Prowling Caracal$0.05
- Sky Tether$0.05
- Swirling Torrent$0.05
- Undercity Scavenger$0.05
- Undercity's Embrace$0.05
- Carrion Imp$0.04
- Get the Point$0.04
- Grotesque Demise$0.04
- Rubble Slinger$0.04
- Sagittars' Volley$0.04
- Sauroform Hybrid$0.04
- Senate Courier$0.04
- Skitter Eel$0.04
- Sphinx of the Guildpact$0.04
- Sylvan Brushstrider$0.04
- Territorial Boar$0.04
- Watchful Giant$0.04
- Burning-Tree Vandal$0.03
- Civic Stalwart$0.03
- Coral Commando$0.03
- Rampaging Rendhorn$0.03
- Scorchmark$0.03
- Haazda Officer$0.02
- Amplifire—
- Awaken the Erstwhile—
- Bedeck // Bedazzle—
- Biomancer's Familiar—
- Domri, City Smasher—
- Dovin, Architect of Law—
- Emergency Powers—
- End-Raze Forerunners—
- Ethereal Absolution—
- Font of Agonies—
- Forest—
- Gate Colossus—
- Growth Spiral—
- Immolation Shaman—
- Island—
- Lavinia, Azorius Renegade—
- Light Up the Stage—
- Lumbering Battlement—
- Mirror March—
- Mortify—
- Mountain—
- Nikya of the Old Ways—
- Plains—
- Precognitive Perception—
- Rakdos Firewheeler—
- Rakdos, the Showstopper—
- Rampage of the Clans—
- Ravager Wurm—
- Rix Maadi Reveler—
- Simic Ascendancy—
- Sphinx of Foresight—
- Swamp—
- The Haunt of Hightower—
- Theater of Horrors—
- Zegana, Utopian Speaker—
Frequently Asked Questions
How is an MTG set's total value calculated?
A set's total value is the sum of every card's current TCGPlayer market price. SpellBook Finance updates this daily and tracks percentage changes over 7, 30, and 90 days so you can spot appreciation or decline across the entire set.
What are the top gainers and losers in an MTG set?
Top gainers are cards whose price increased the most over the trailing 30-day window. Top losers are those that dropped the most. These lists help you identify which singles are driving a set's overall performance up or down.
How do sealed products relate to set performance?
Sealed products from the same set are listed on each set page with current market prices. Comparing sealed product prices to the set's singles value helps you decide whether cracking boxes or holding them sealed is the better financial play.
What are the most expensive cards in Ravnica Allegiance?
The most valuable cards in Ravnica Allegiance by current market price are Smothering Tithe ($55.97), Blood Crypt ($15.37), Hallowed Fountain ($14.39), Breeding Pool ($14.03), Guardian Project ($13.65). See the full card list with live prices on this page.